Business performance data and reporting are crucial to any food and beverage operation. However, another important aspect of this is proactive data-driven decision-making, which many businesses don’t have the tools or software to do accurately.
Ongoing changes within the hospitality industry mean that the capability to make effective business decisions is more significant than ever. With the ever-changing market conditions in mind, Tevalis has created and built a brand-new tool to enable this: Insights.
Functions such as forecasted sales, floorplan analysis, and a customisable dashboard, provide precise and detailed information based on accurate data and relevant metrics. Similar to all Enterprise modules, the Insights tool updates with a live-data feed.
Years of Experience
Live Sites
Devices Supported
Integrated Partners

“Tevalis gives us a lot of freedom with functionalities, discounts, and easily being able to manage difficult situations: splitting payments, voiding items, error-correcting. The functionalities are simple for our teams, but they are also reportable in a way that we can track. Working with Tevalis gives us peace of mind: it’s a stable and reliable system.”


“The system is so user-friendly, our teams adapted to it very well in terms of speed of service. We have small kiosks and larger teams in the main restaurant, we have quick service areas, grab-and-go windows and retail locations. Improved communications with a system that makes it all easy are so important for us, especially during our busy season.”
"I would recommend Tevalis to any other business as it takes the stress out of the day-to-day operations and you can focus on what truly matters to make a successful business happy."
“Tevalis day to day brings us a whole ecosystem that we’re getting from the moment our guests walk through the door. Moving to Tevalis to us was a very good decision. We needed to move on as a business and Tevalis helped us move forward.”

“We deployed Tevalis back in 2012 for the proposal of taking over our previous till system, I got a very family-oriented vibe from them and were a company that we thought we could grow with from the early days and we’ve done exactly that.”
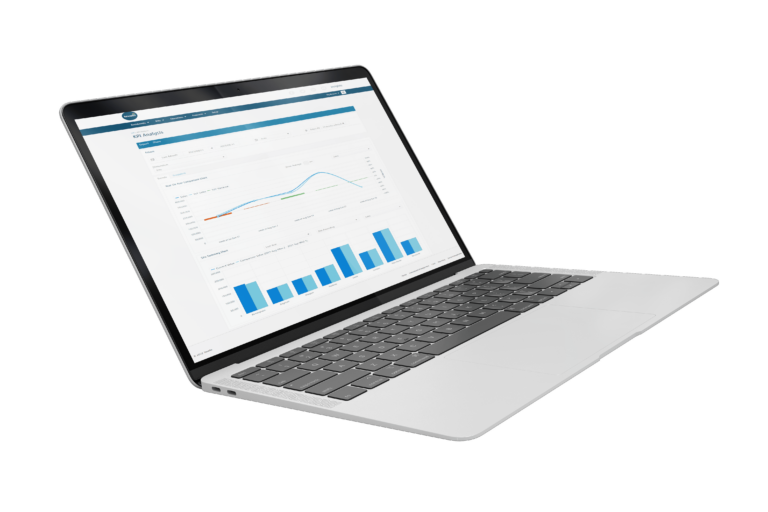
With graphical analysis and live data, the Insights dashboard provides easy access to business performance data. The dashboard is completely customisable to you and your business’s needs, with options to create dashboards for individual users or multiple users, and global dashboards accessible by all.
Fully configurable, the dashboard displays relevant reports through charts and widgets with varying metrics for different figures. Quickly view data such as year-on-year performance, percentage growth over the last year, performance vs. budget comparison, and more.

One of the most advantageous functions of the Insights tool is forecasting. Considering sales performance data alongside conditions such as weather, geo-locations, and bank holidays, future sales performance can be predicted.
Our model is accurate and swift: the forecast provides figures for each day and each site and will be used in reporting to determine overperformance or underperformance.

The KPI Analysis area of the Insights tool has two key functions: Trends and Snapshot. Both provide valuable insight into the ongoing performance of your business and can be filtered by numerous dimensions for further detail. These include site, price group, product group, product type, sales area, session, and cost centre. The data can also be filtered by date.
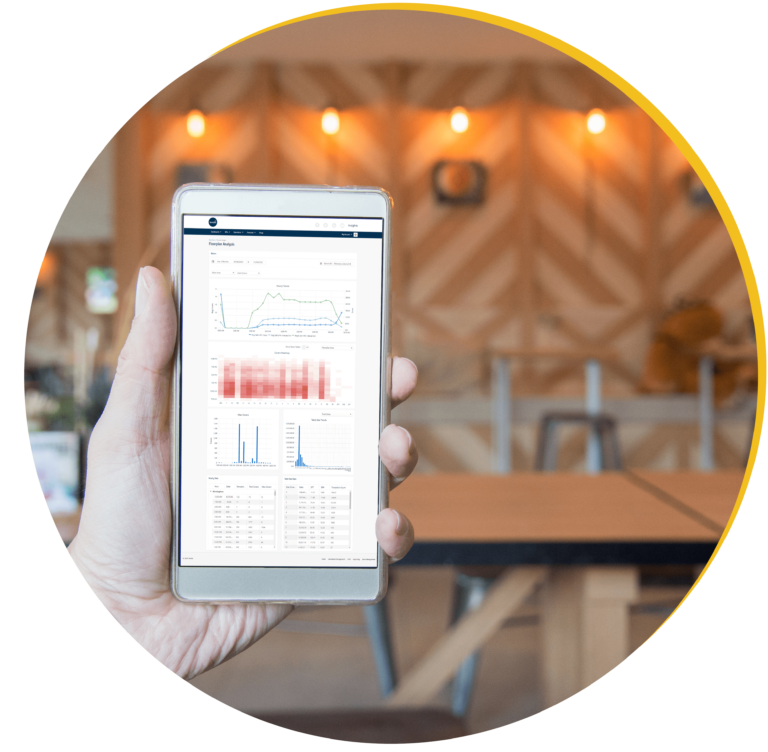
As well as being able to use the comprehensive data available for broader business decisions, the Floorplan Analysis tool enables more granular research of ongoing trends in your sites. This can have a significant impact on the profitability and success of each area within a venue.
Select which site or group of sites you want to analyse or select all sites for a complete overview. Data can also be shown for specific dates or periods.
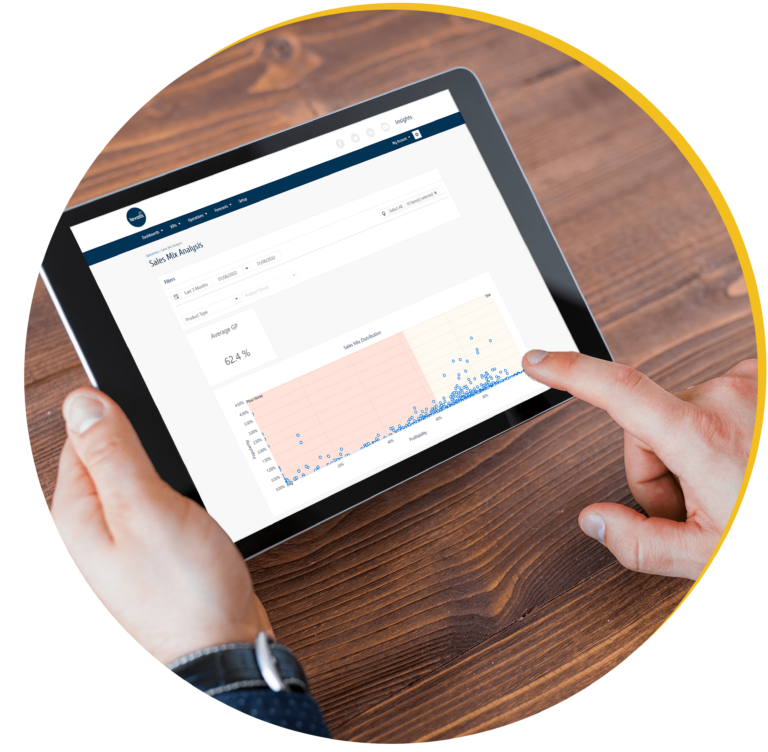
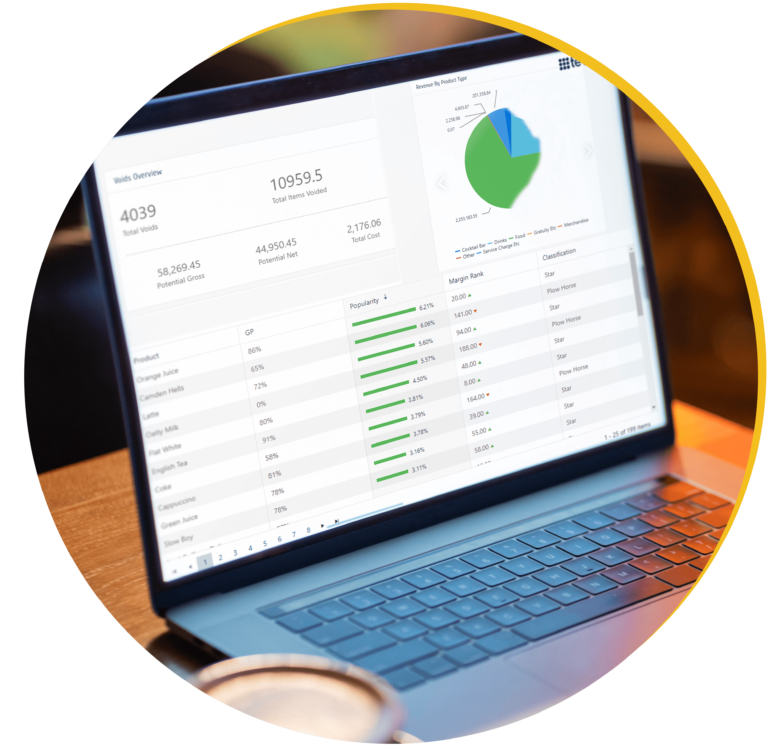
The Sales Mix Analysis function enables in-depth investigation into the popularity and profitability of your venues’ products. Proactively adjust your operations to run more cost-effectively and generate higher profits.
This feature also benefits your business as marketing can be tailored to specific products to boost sales or attract customers, menu changes and price adjustments are easier as you have the data to support your decisions, and you can easily investigate any unusual changes in popularity or profits.
 Dashboard
  Sales Forecasting
  KPI Analysis
  Floorplan Analysis
  Sales Mix Analysis